Muisne Earthquake, Ecuador – April 16, 2016 (Mw=7.8)
GEM Hazard Team
An earthquake of Mw=7.8 (USGS Earthquake Hazard Program) hit the pacific coast of Ecuador close to the border with Colombia on April 16th, 2016 (UTC) causing large damage and casualties in many localities along the Ecuadorian coast. The major city close to the epicentral area (according to the USGS PAGER) is Pedernales.
In this post we provide information mostly collected in the framework of the project SARA, coordinated by GEM in the period 2014-2015. This is a first version completed on April 18th, 2016.
Past seismicity
In the area where the Muisne earthquake occurred, the Nazca plate subducts obliquely eastward beneath the South America plate at a velocity of 61 mm/yr. The hypocenter of the earthquake was located at a depth of 20 km and the available focal mechanism solutions are consistent with the hypothesis (see USGS focal mechanism solution) of a rupture on the main plate boundary, immediately below (or just within the limit of) the brittle portion of the interface.
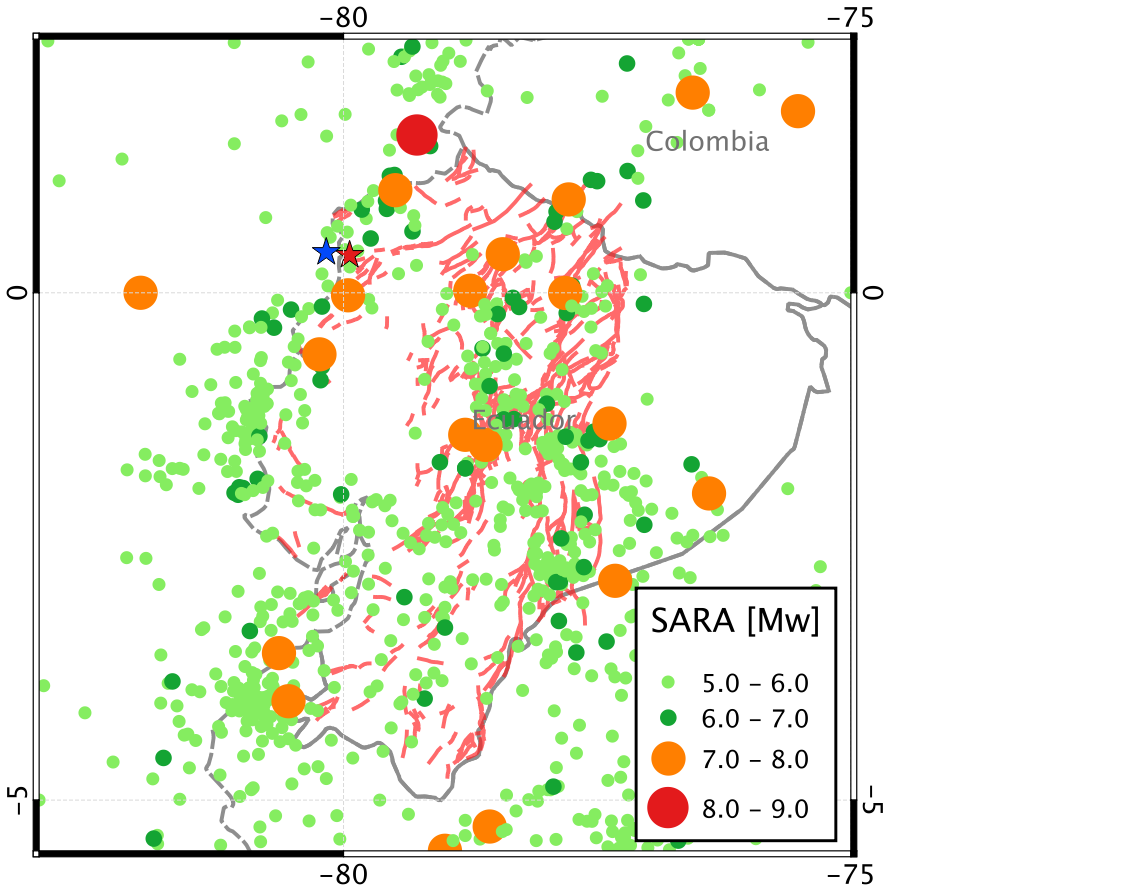
Ecuador has a history of large subduction zone earthquakes with several events of magnitude 7 or larger occurred since 1900 (1906 Mw=8.35, 1942 Mw=7.8, 1958 Mw=7.7, 1979 Mw=8.2 and 1998 Mw=7.1). The figure below shows the seismicity included in the earthquake catalogue compiled by a large community of South American scientists in the framework of the SARA project together with the traces of the faults in active shallow crust. The red and the blue stars indicate the position of the epicenter of the 2016 earthquake according to the USGS and the Geophysical Institute of the Escuela Politecnica National in Quito, respectively.
 Past seismicity included in the historical and instrumental components of the
SARA catalogue. The red and blue stars show the epicenter of the Muisne
Earthquake according to the USGS and Istituto Geofisico in Quito,
respectively.
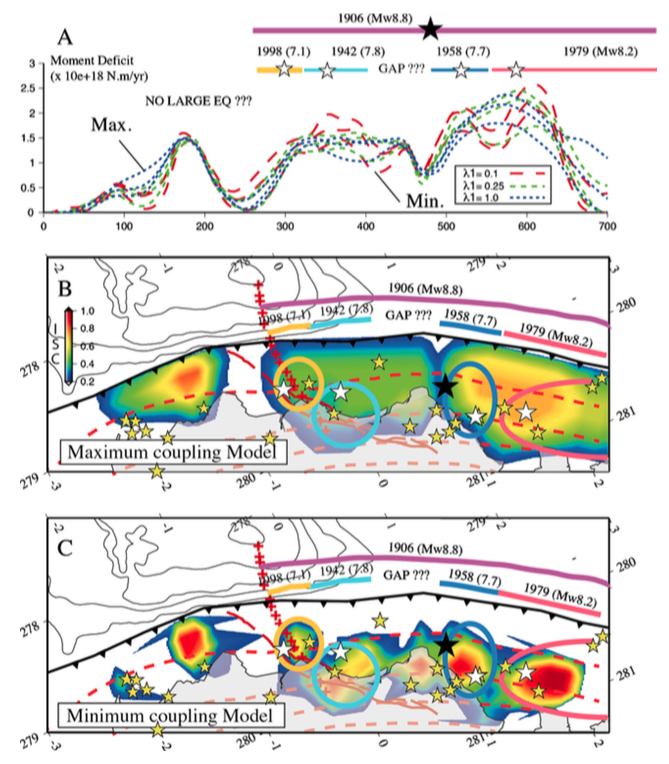
Previous studies (e.g. Chlieh et al., 2014) suggested that some of the asperities along the subduction west of the Ecuador coast did not break since the last very large earthquake occurred in this portion in 1906 (Mw=8.35). The figure below (Chlieh et al., 2014) shows the spatial distribution of the moment deficit along the subduction zone, the position of the main ruptures occurred during the last century and the areas where potential gaps were identified using non-linear inversion of GPS measurements to determine the interseismic coupling distribution.
 Subduction interface sources included in the SARA hazard model (Garcia et al.,
2016). The star shows the position of the epicenter of the 2016 earthquake.
At this link you find an animation showing epicenters aftershocks that occurred until April 18th. The distribution seems in good agreement with the finite fault solution provided by the USGS.
Available hazard models
The most recent hazard models developed for this area are the following ones:
- Petersen et al. (2010)
- Beauval et al. (2014)
- Garcia et al. (2016; in preparation)
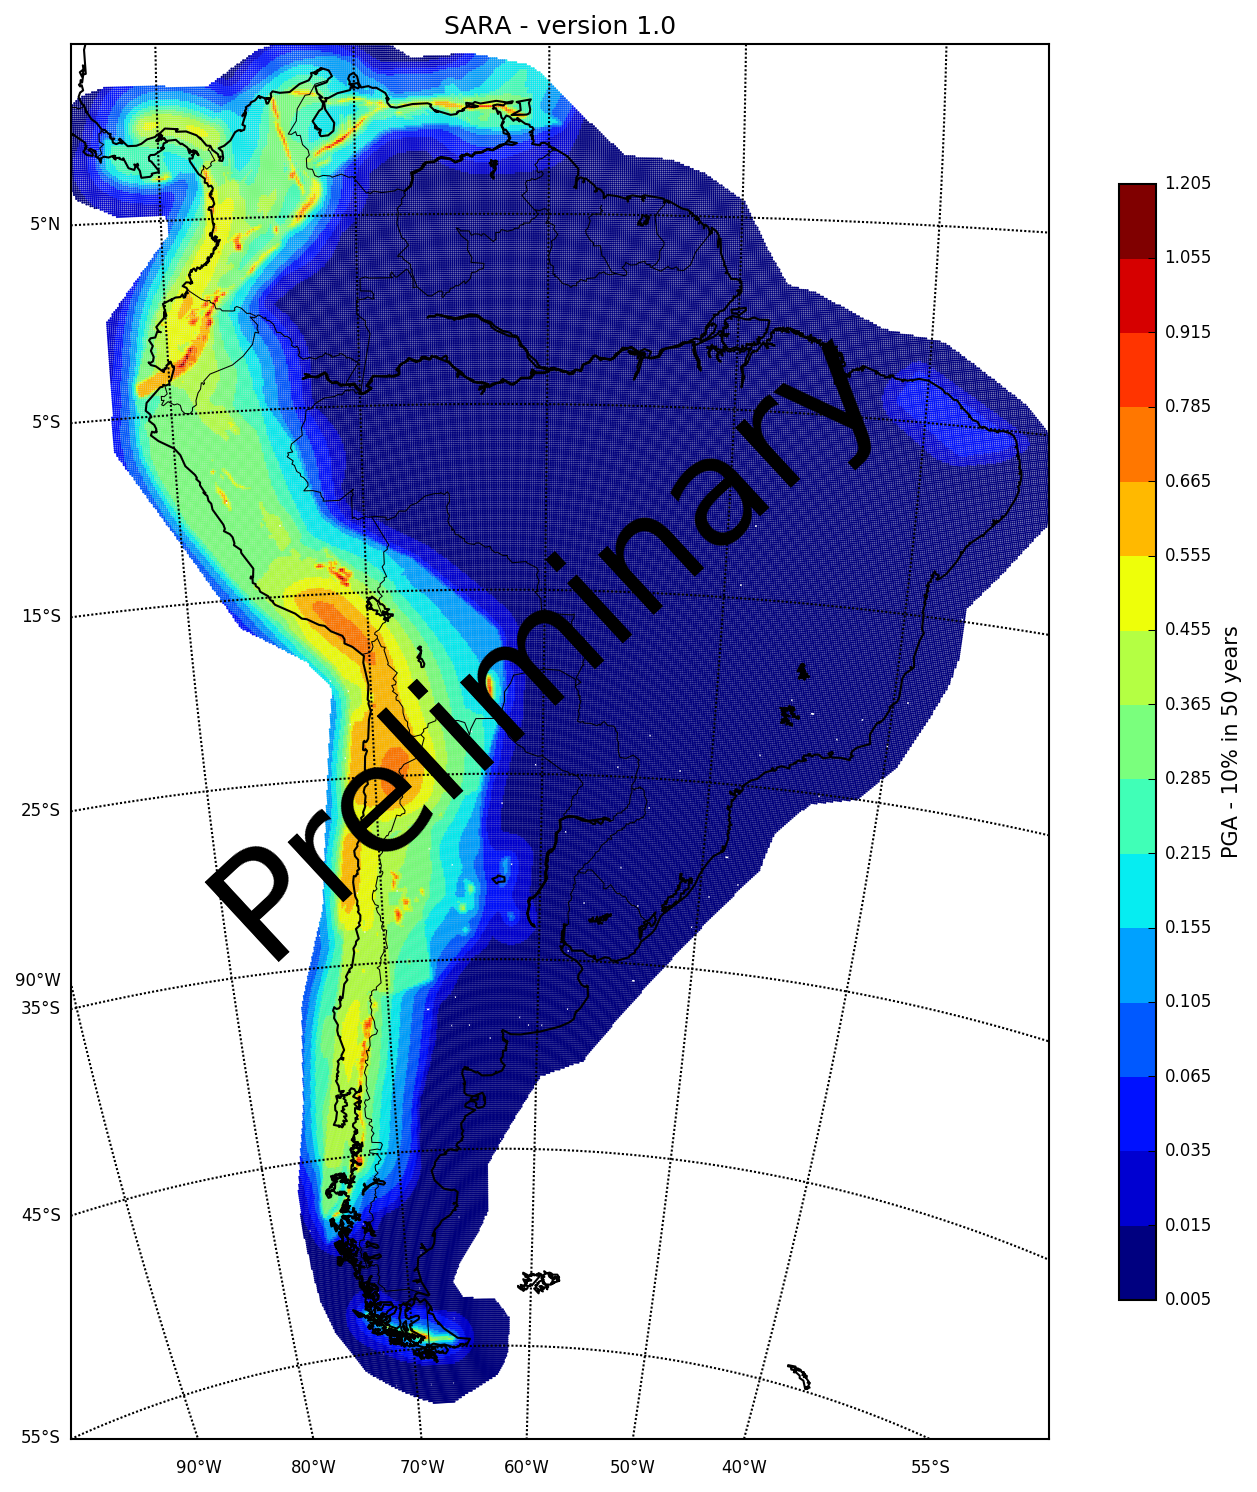
In the model of Petersen et al. (2010) the hazard – expressed in terms of the Peak Ground Acceleration (PGA) with 2% probability of being exceeded in 50 years – for the area stricken by the 2016 earthquake is larger than 1.0g. The damaged area corresponds to the area exhibiting the highest hazard in Ecuador.
The model of Garcia et al. (2016) developed in the framework of the SARA project for the same area indicates values of PGA with 10% probability of being exceeded in 50 years in the range between 0.45 and 0.55 g.
The maximum values of PGA computed by the USGS Shakemap system for this earthquake are around 0.4g, largely below the values of hazard discussed above. A direct comparison between the observed values of shaking and the values of hazard computed with a probabilistic seismic hazard analysis must be done with extreme caution since the two values have completely different meanings. However, should the largest values of shaking computed by the USGS Shakemap be confirmed, based on the hazard models considered these can be associated with return periods close or lower than 475 years.
 Seismic hazard map for South America computed using the SARA hazard model
(Garcia et al, 2016). The map shows PGA with 2% probability of exceedence in 50
years.
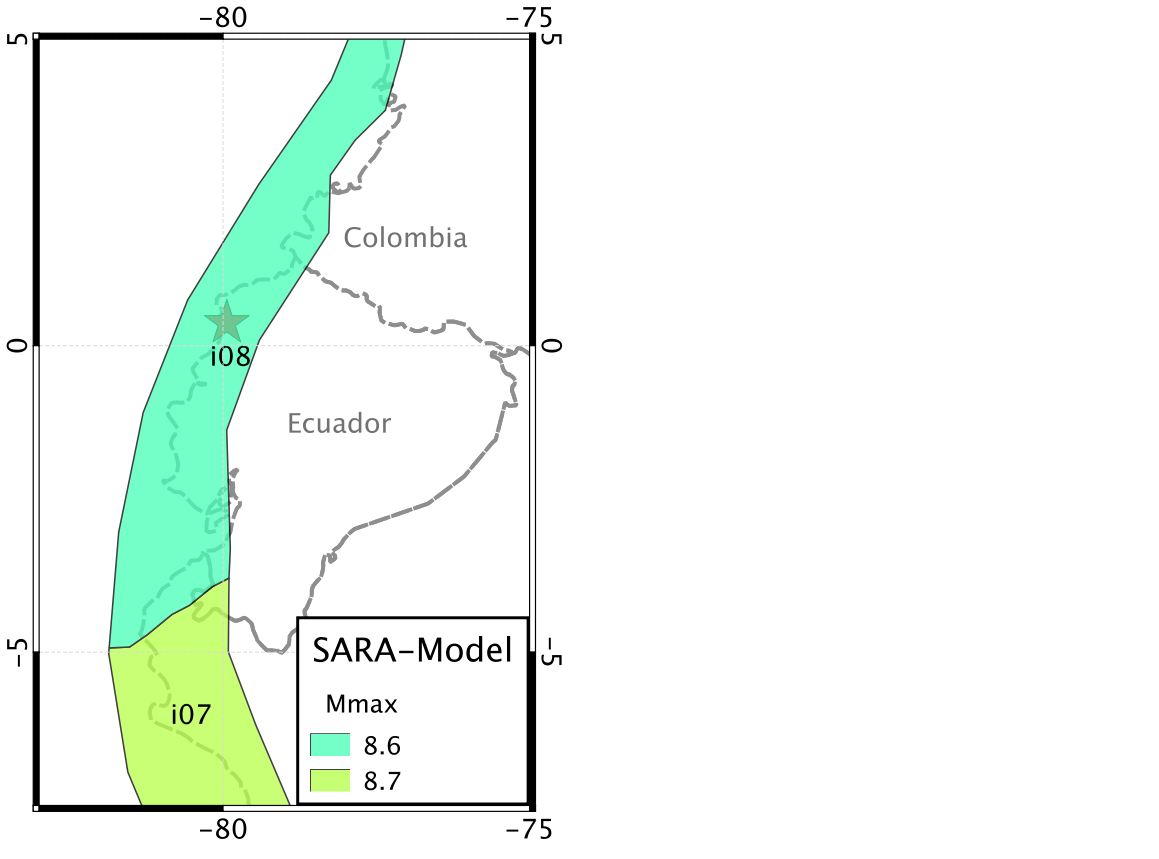
The subduction source included in the model of Garcia et al. which – presumably – generated the 2016 earthquake has a maximum magnitude assigned of 8.8 (see polygon i08 in the Figure below). The overall geometry of the fault appears to be consistent with the finite rupture solution provided by the USGS although the dip angle seems lower in the latter case.
 Subduction interface sources included in the SARA hazard model (Garcia et al.,
2016). The star shows the position of the epicenter of the 2016 earthquake.
Want to read more? Please take a look at the post on the Muisne Earthquake published on the GEM integrated Risk Blog.